COVID-19: Same Patient, Different Data
How mixed CSV and Excel files, Japanese character encodings, source-specific patient IDs, and conflicting values turned COVID-19 data integration into an identity and provenance problem.
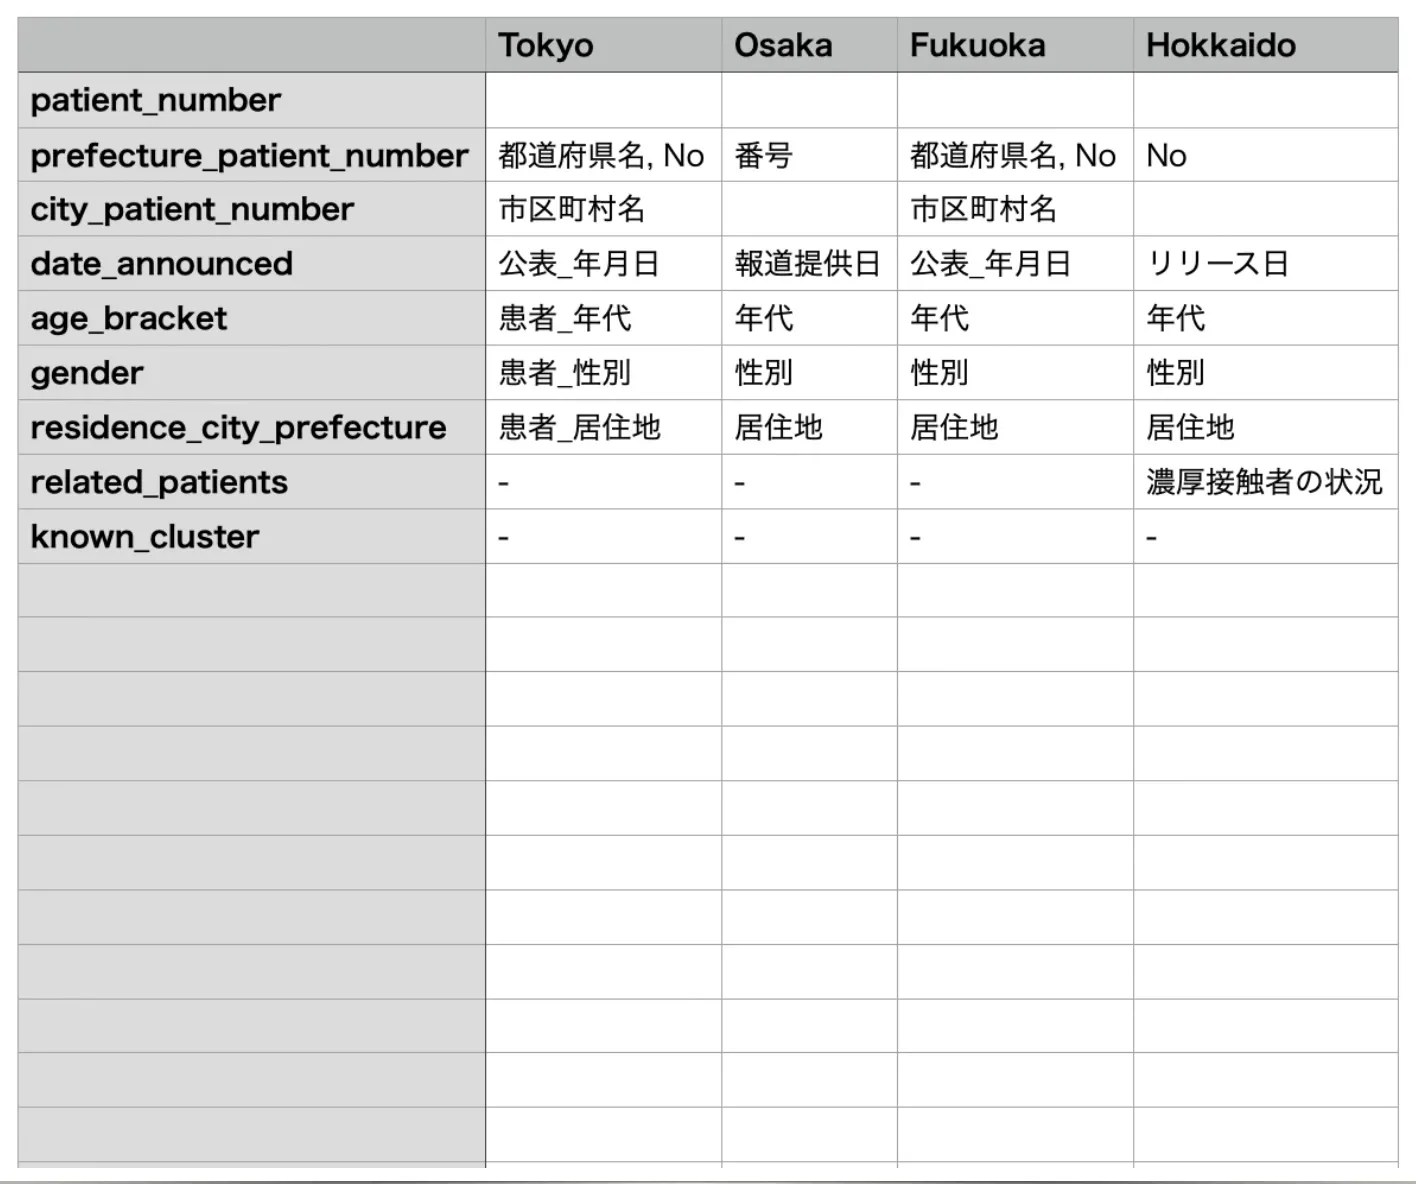
During my work on the Japan COVID-19 Coronavirus Tracker, I encountered a problem that looked simple at first.
The same patient could appear in more than one public dataset.
A prefecture might publish one record, while a city might publish another for the same person. However, the identifiers and values did not always match.
Before those records could even be compared, the source files themselves had to be made usable. Local governments published a mixture of CSV and Excel files. Column names and value formats differed, and the character encoding was not always UTF-8.
What first appeared to be a data-cleaning problem was actually a combination of format conversion, identity resolution, provenance, and conflict management.
Before Comparing Patients
The source data did not arrive in one consistent format.
Depending on the organization, the data could be published as:
- CSV files
- Excel workbooks
- tables embedded in web pages
- files linked from press releases
Even CSV files did not share a single technical format. Some files used UTF-8, while others used Japanese character encodings such as Shift_JIS or Windows-31J. They had to be detected and converted to UTF-8 before they could be processed consistently.
Excel files introduced additional differences, including worksheet names, header positions, empty rows, merged cells, and values formatted for visual presentation rather than machine processing.
The first stage was therefore not patient matching. It was creating a stable input pipeline:
CSV / Excel / Web tables
        ↓
encoding and file-format handling
        ↓
UTF-8 normalized records
        ↓
schema and value normalization
        ↓
identity and conflict analysis
Japanese note:
自治体の公開データはCSVだけではなくExcelも混在していました。CSVもUTF-8に統一されておらず、日本語環境で使われる文字コードを判定してUTF-8へ変換する必要がありました。同じ患者を照合する前に、まず読み込める状態へそろえる作業が必要でした。
Similar Columns Did Not Always Mean the Same Thing
After the files were readable, the next problem was schema normalization.
Similar concepts were published under different column names. For example, a date could appear as:
公表日       publication date
判明日       confirmation date
報道提供日   press release date
These labels are related, but they do not necessarily mean the same event.
Age values also required care:
10歳未満     under 10
1歳未満      under 1
未就学児     preschool age
These were published categories, not precise ages. Converting all of them into one numeric value would have removed part of the source meaning.
The goal was therefore not to force every source into an apparently perfect common schema. The safer approach was to preserve the original value and add normalized values only where the transformation was justified.
One Patient, Multiple Identifiers
In Japan, prefectures and some large cities published their own case information.
This meant that one real-world patient could appear in multiple datasets.
For example:
Prefecture record: Fukuoka Prefecture patient 1200
City record:       Fukuoka City patient 430
Both records might refer to the same patient, but the numbers were different because each organization assigned identifiers within its own dataset.
A patient number was therefore not a universal identifier. It only had meaning together with its issuing organization and dataset.
A safer representation was:
FukuokaPrefecture#1200
FukuokaCity#430
The two source-specific identifiers could then be connected to a shared patient or case node.
(:PrefectureRecord)-[:REFERS_TO]->(:Patient)
(:CityRecord)-[:REFERS_TO]->(:Patient)
The original identifiers were not discarded. They remained attached to the records that published them.
This allowed the graph to express three different facts:
- Fukuoka Prefecture published one identifier.
- Fukuoka City published another identifier.
- The two records were currently believed to refer to the same patient.
The graph did not automatically prove that the records represented the same person. That mapping still required investigation, source knowledge, and sometimes manual review.
Four Different Problems
The work became easier to understand when I separated it into four layers.
| Layer | Problem | Example |
|---|---|---|
| File | Different delivery formats and encodings | CSV, Excel, UTF-8, Shift_JIS-compatible files |
| Schema | Different column names and value conventions | 公表日 and 判明日 |
| Identity | Different identifiers for the same patient | Prefecture patient 1200 and city patient 430 |
| Provenance | Conflicting values and corrections | One source says 30s, another says 40s |
These layers were connected, but treating them as one generic “CSV problem” would have hidden the real causes.
Linked Records Could Still Disagree
Even after two records were linked to the same patient, their values could differ.
A simplified example:
Initial data
Prefecture: Male, 40s
City:       Male, 40s

Later
Prefecture: Male, 30s
City:       Male, 40s
Several explanations were possible:
- one source applied a correction and the other did not
- the sources were updated at different times
- the mapping between the records was wrong
- the import or conversion logic introduced an error
- the records did not actually describe the same patient
A mismatch did not automatically mean that one source was wrong. It was evidence that needed investigation.
Preserve the Source Records
A common mistake in data integration is to merge records too early.
If two source records are forced into one row, a difference may disappear when one value overwrites the other.
The safer model was to preserve each source record separately:
(:PrefectureRecord {ageGroup: "30s"})-[:REFERS_TO]->(:Patient)
(:CityRecord       {ageGroup: "40s"})-[:REFERS_TO]->(:Patient)
This kept three facts visible:
- the prefecture published
30s - the city published
40s - both records were linked to the same patient node
The disagreement remained part of the data.
That was important because a contradiction is not always noise. Sometimes it is the most valuable fact to investigate.
Japanese note:
同じ患者と思われるレコードでも、県と市で値が異なる場合がありました。どちらかを上書きして一つの値にすると不一致が消えてしまいます。出典ごとのレコードを残し、同じ患者を指す関係だけを追加することで、「誰がどの値を公表したか」を維持しました。
Finding Conflicts with Cypher
Cypher could be used to find connected records that disagreed.
A simplified check might look like this:
MATCH (pref:PrefectureRecord)-[:REFERS_TO]->(p:Patient)<-[:REFERS_TO]-(city:CityRecord)
WHERE pref.ageGroup <> city.ageGroup
   OR pref.gender <> city.gender
RETURN p, pref, city;
This query did not decide which value was correct.
It showed that two records linked to the same patient contained different values. A person could then inspect the original pages, publication dates, correction history, encoding and transformation steps, and the patient mapping itself.
The graph supported investigation; it did not replace it.
What Neo4j Helped Preserve
Neo4j was useful because the data did not have to be flattened into one table too early.
The graph made it possible to:
- keep each source record
- retain source-specific patient identifiers
- connect records believed to describe the same patient
- compare values across connected records
- preserve disagreements instead of overwriting them
- trace each value back to the organization and dataset that published it
The value of the graph was not only visualization. It provided a structure for explaining why records were connected and where they disagreed.
What Neo4j Did Not Solve Automatically
A graph database does not automatically solve identity resolution.
It does not automatically know:
- whether two records describe the same person
- which source contains the correct value
- whether a correction reached every published file
- whether a mismatch came from the source data or the conversion pipeline
- whether mojibake or parsing failure changed a value during import
What it can do is preserve the evidence required for investigation.
That is already valuable.
What I Would Model Today
If I rebuilt the model today, I would make both the publication context and the matching process explicit.
(:SourceRecord)-[:PUBLISHED_BY]->(:Organization)
(:SourceRecord)-[:PUBLISHED_IN]->(:DatasetVersion)
(:SourceRecord)-[:IMPORTED_FROM]->(:SourceFile)
(:SourceFile)-[:HAS_FORMAT]->(:FileFormat)
(:SourceFile)-[:USED_ENCODING]->(:CharacterEncoding)
(:SourceRecord)-[:HAS_IDENTIFIER]->(:ExternalIdentifier)
(:SourceRecord)-[:REFERS_TO]->(:Patient)
I would also record how a source record was matched to a patient:
(:SourceRecord)-[:MATCHED_TO {
  method: "manual review",
  status: "confirmed",
  reviewedAt: date("2020-08-15")
}]->(:Patient)
This would make it possible to explain not only that two records were linked, but also why they were linked and how confidently the decision was made.
The source-file metadata would also make the ingestion process auditable. A problem could be traced back to the original file, format, encoding, dataset version, or transformation step.
What I Learned
The hardest part was not simply that files had different formats.
The process contained several separate questions:
- Can the file be read correctly?
- Can its values be interpreted without losing their original meaning?
- Do two records refer to the same patient?
- Why do the linked records contain different values?
- Which source and version published each value?
The main lesson is:
Data integration should not erase differences before they have been understood.
Converting files to UTF-8 and normalizing schemas made comparison possible. Preserving source-specific records and identifiers made the comparison explainable. The graph then made conflicts visible without forcing an immediate single answer.
This pattern is not limited to COVID-19 data. It also appears in master data management, system migration, regulatory data, customer records, and Knowledge Graph or GraphRAG systems built from multiple sources.
When sources disagree, the first goal is not always to select one value. Sometimes the first goal is to show what each source says, how the records are connected, and where the uncertainty remains.
Related Article
This article focuses on file normalization, same-patient matching, source-specific identifiers, and conflicting values.
A related article describes the broader maintenance process, including Related Patient graphs, Git history, feedback to local governments, and later corrections.
About the Project
The Japan COVID-19 Coronavirus Tracker was a collaborative project that collected and presented COVID-19 case information from across Japan.
I participated as one of its data maintainers. The work included collecting data from national and local government sources, converting mixed files and encodings into a consistent processing format, checking source-specific identifiers, comparing records, and loading the relationships into Neo4j for validation.
Related work
Discuss a related technical question.
I support teams that need to evaluate whether a technology fits a real-world problem, review the details that matter, or clarify a practical next step.
日本語・英語どちらでもご相談いただけます。